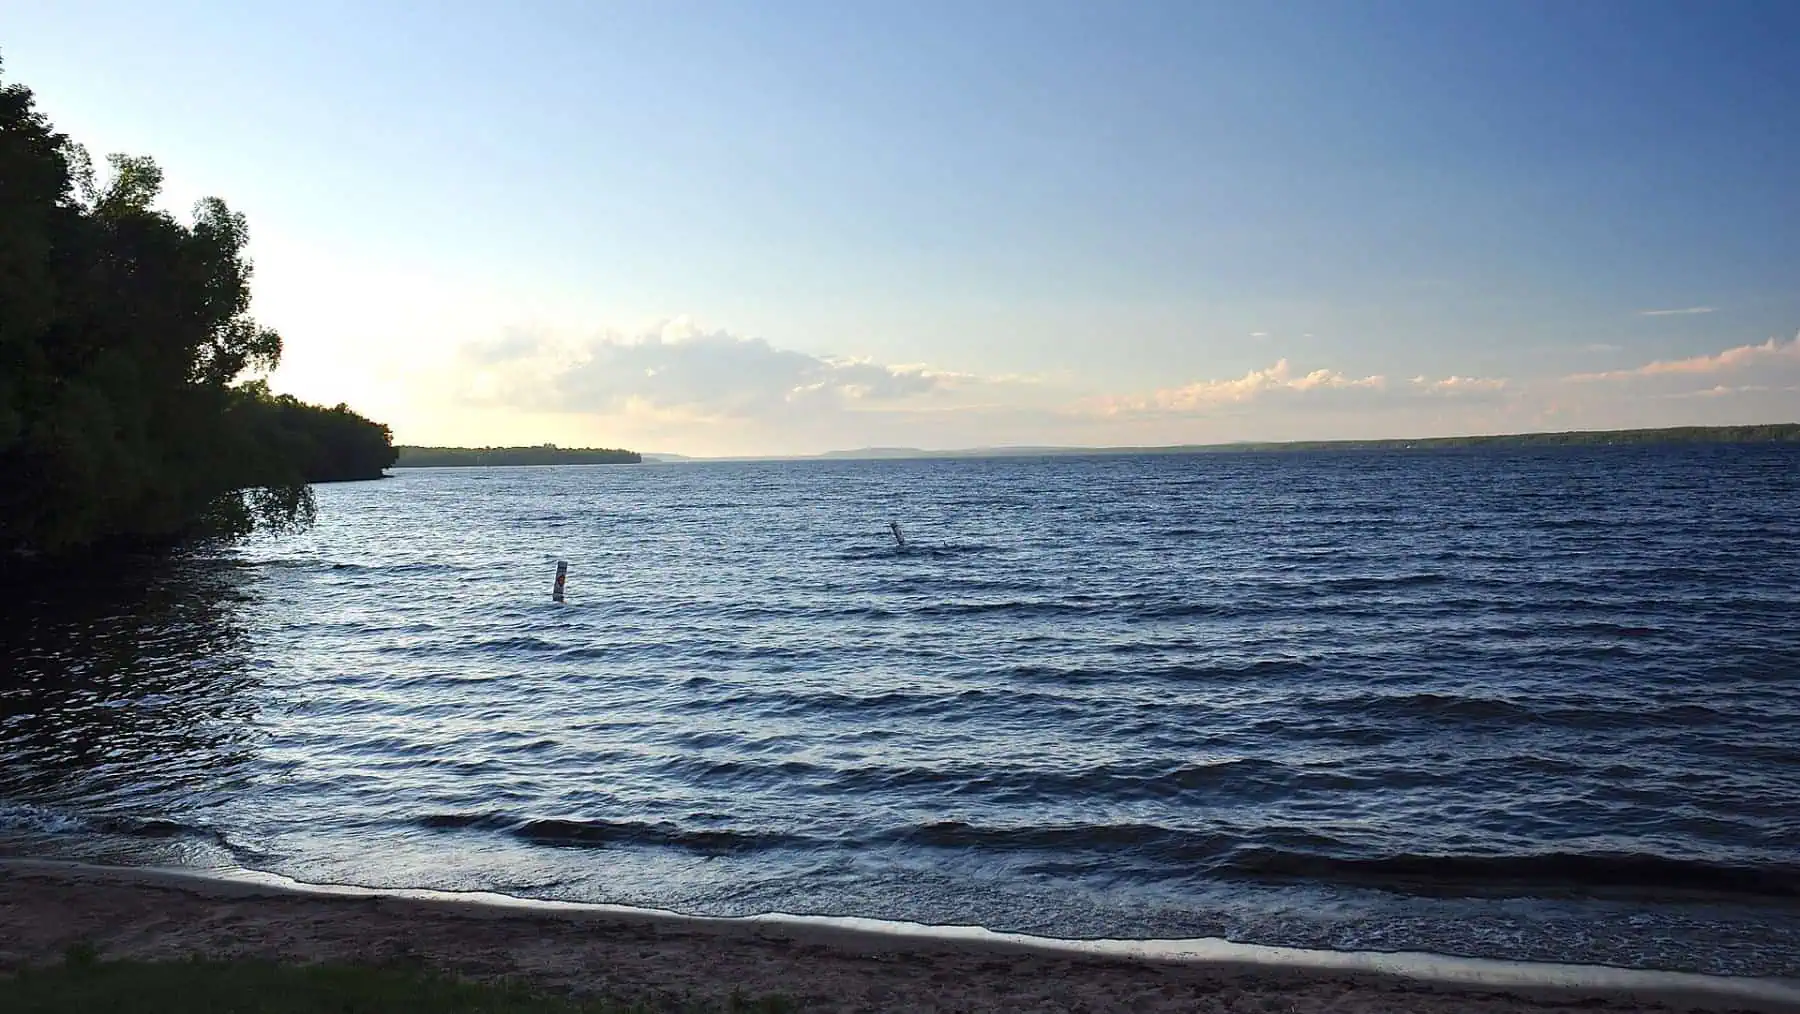
The U.S. Drought Monitor’s map for August 25 put 250 square miles of Gogebic County in extreme drought. No county in the Upper Peninsula had been in that category since the map of June 29, 2010. Sixteen years.
It is also the only extreme drought anywhere in Michigan right now, and the first in the state since a patch of Lenawee County, down on the Ohio border, in the fall of 2024.
Here is the part that does not read the way you would expect. Gogebic County had a nearly normal August. The coop gauge at Ironwood measured 2.78 inches between August 1 and 26, against a 1991 to 2020 normal of 3.00 for those dates. That is 93 percent, an unremarkable seventeenth driest in the station’s modern record.
Widen the window and the picture changes completely. From May 1 through August 26, Ironwood recorded 6.38 inches against a normal of 14.30. That is 45 percent of normal, a deficit of nearly eight inches, and the driest May-through-August stretch in the station’s 1991 to 2026 record.
That is what the Drought Monitor measures. Drought is a running balance, not a monthly rain total, and the balance in the western U.P. went negative in May and never recovered. The extreme designation arrived last week because the deficit finally got deep enough, not because last week was dry. Gogebic first showed moderate drought on the July 14 map, severe drought on July 21, and extreme drought on August 25.
The driest August gauges in the U.P. are two counties east of the extreme drought. At the National Weather Service office in Negaunee Township, which is the official climate site for Marquette County, August 1 through 26 brought 0.69 inches against a normal of 2.28. That is 30 percent of normal, the fifth driest such stretch in the office’s 67-year record, and the driest since 2008.
The wettest single day there all month was 0.28 inches, on August 7. Nothing else reached a fifth of an inch. Four more days registered a trace, which is measurable in the sense that somebody wrote it down and in no sense a plant would recognize.
At Stambaugh, in Iron County, the same 26 days produced 0.12 inches against a normal of 2.60. Five percent, and the driest August-to-date in that station’s modern record. Iron Mountain’s airport gauge managed 0.57. Rain fell where it was less needed: Sault Ste. Marie finished at 1.84 inches, Houghton County’s airport at 1.19, Copper Harbor at 0.96, and the far eastern U.P. did better still.
County by county, the August 25 map has every acre of Dickinson in moderate drought or worse and a fifth of it in severe. Menominee is 96 percent moderate or worse and nearly half severe. Ontonagon and Iron are in it too, and only Gogebic reaches extreme. Chippewa, Luce and Mackinac are fully abnormally dry and not in drought at all.
Marquette County is the fast mover. It was entirely drought-free on the map of August 4. Three weeks later 75 percent of it is abnormally dry and 38 percent is in moderate drought.
None of which makes this a dry year, and the phrase extreme drought invites exactly that wrong conclusion. Michigan just had its third wettest January through July on record in a series that starts in 1895, running 5.53 inches above normal. At the Negaunee Township office, precipitation since January 1 is above the 1991 to 2020 normal, 24.93 inches against 22.56, because March alone came in 3.66 inches wet.
The growing season is the anomaly, not the year. May ran 2.45 inches short at that station. June and July finished within a fifth of an inch of normal, which is to say they did nothing to repair May. Then August took out another 1.59 inches. That is also how the same office could log the second warmest July on record with a rain total that looked ordinary. Heat pulls water out of soil and vegetation whatever the gauge says.
In early June the U.P. was under an extreme fire danger rating, the highest the state uses, burn permits were closed across northern Michigan, and crews were putting out fires in the Hiawatha National Forest. Drought is worse now than it was then. Fire danger is not.
The National Weather Service fire weather forecast issued at 6:04 AM on August 27 expects no elevated fire weather conditions over the next several days, because minimum humidity should stay above 30 percent and winds should stay light. It says so while naming the drought directly: light winds “look to keep the fire weather concerns at bay even despite the drought conditions over there.”
Fire danger is a same-week product of wind, humidity and temperature. Drought is the multi-month balance underneath it. June had the first without much of the second, and late August has the second without the first. Both readings are correct, and neither one cancels the other.
Forecasters expect the best chance of widespread rain since early in the month this Saturday into Sunday, with a 50 to 75 percent probability of at least a tenth of an inch across much of the U.P. A tenth of an inch is not the story. Ironwood is nearly eight inches down since May, and the same forecasters wrote that morning that they were “hoping the potential rainfall will bring relief to the area, especially the west where the drought conditions are worst.” One weekend of thunderstorms can move a fire danger rating in a day. Moving a four-month deficit takes a season.
More worth reading


Yooper Hub community
The conversation
Know something this story missed? Corrections and additions get read by an editor and folded into the article, with credit.
Real neighbors, real names. A Yooper Hub editor reads your first comment before it appears; after that you’re a known neighbor and your comments post right away. No account required. Community guidelines
Nothing here yet. A sentence is plenty: a correction, a name, or what you remember about this place.
Sources, credits, and reporting details
Sources & accountability
How this story was reported
Editorial methodAnalysis
Last verifiedAug. 27, 2026
Corrections statusNo material correction note is recorded on this article.
AI assistanceResearched and drafted with AI tools. Reviewed and approved by editor Keegan O’Brien. Tool: Claude.
Verification note: Every 2026 figure stops at August 26, the last complete day in the ACIS archive when this was written, and every normal is computed over the same 26 calendar dates rather than a whole-month normal. Drought Monitor percentages are cumulative in the source API, so the copy says 'or worse' wherever it uses one; the exclusive figures published on drought.gov reproduce them to a tenth of a point, which is the cross-check. The sixteen-year claim was verified by sweeping all fifteen U.P. counties for D3 weeks from 2000-01-04, not assumed; the same sweep placed Michigan's 2024 extreme drought in Lenawee County and corrected an earlier draft that put it in the northern Lower Peninsula. Two things are deliberately not claimed: current DNR burn permit status, because michigan.gov returns HTTP 403 to automated fetches and the page could not be read, and any crop, well or streamflow impact, for which no source was obtained. SHORT SHELF LIFE: the next Drought Monitor map publishes 2026-09-03 and rain was forecast for the weekend of August 29. Re-query ACIS and the Drought Monitor before publishing after that date rather than adjusting the copy by hand.
Primary sources
-
Applied Climate Information System, daily precipitation for seven Upper Peninsula stations — NOAA Regional Climate Centers
Accessed Aug. 27, 2026.
The primary climate archive, queried directly rather than through any news coverage. Rebuild from the same queries if the numbers are ever checked; do not read them off a chart.
-
U.S. Drought Monitor county and state statistics, map valid 2026-08-25 — National Drought Mitigation Center, University of Nebraska-Lincoln
Published Aug. 25, 2026. Accessed Aug. 27, 2026.
Queried through the Drought Mitigation Center data services API. Percentages returned by this API are cumulative, so d1 means D1 or worse; the copy preserves that wording throughout.
Additional reporting
-
Fire Weather Planning Forecast for Upper Michigan, FNUS53 KMQT, corrected issuance — National Weather Service Marquette
Published Aug. 27, 2026. Accessed Aug. 27, 2026.
Retrieved as the office's current product from api.weather.gov. NWS Marquette has issued no drought information statement; the office's product type list carries no such type, which is why the story quotes routine forecast products and does not imply a statement exists.
-
Area Forecast Discussion, FXUS63 KMQT — National Weather Service Marquette
Published Aug. 27, 2026. Accessed Aug. 27, 2026.
Retrieved from api.weather.gov.
-
Michigan drought conditions, state summary — NOAA National Integrated Drought Information System
Accessed Aug. 27, 2026.
Used for statewide context and as an independent reading of the same map.
-
Extreme Fire Danger Has Taken Hold of the U.P. and Crews Are Already Putting Out Flames — Yooper Hub
Published Jun. 4, 2026. Accessed Aug. 27, 2026.
Post 303, this site's own earlier reporting, and the story's primary internal link.
Photo and media credits
-
Lake Gogebic.JPG (featured image) — Skye Marthaler, via Wikimedia Commons
Featured image record. Accessed Sep. 10, 2026. CC BY-SA 3.0.
Photographed 2014-07-06. Resized for the site.
